Diagrams
Diagrams are very visual views into specifc parts of a project. They show selected elements and relationships as data flow diagrams. A project can contain multiple diagrams. Each diagram can focus on a different part of the product, system, or feature set.
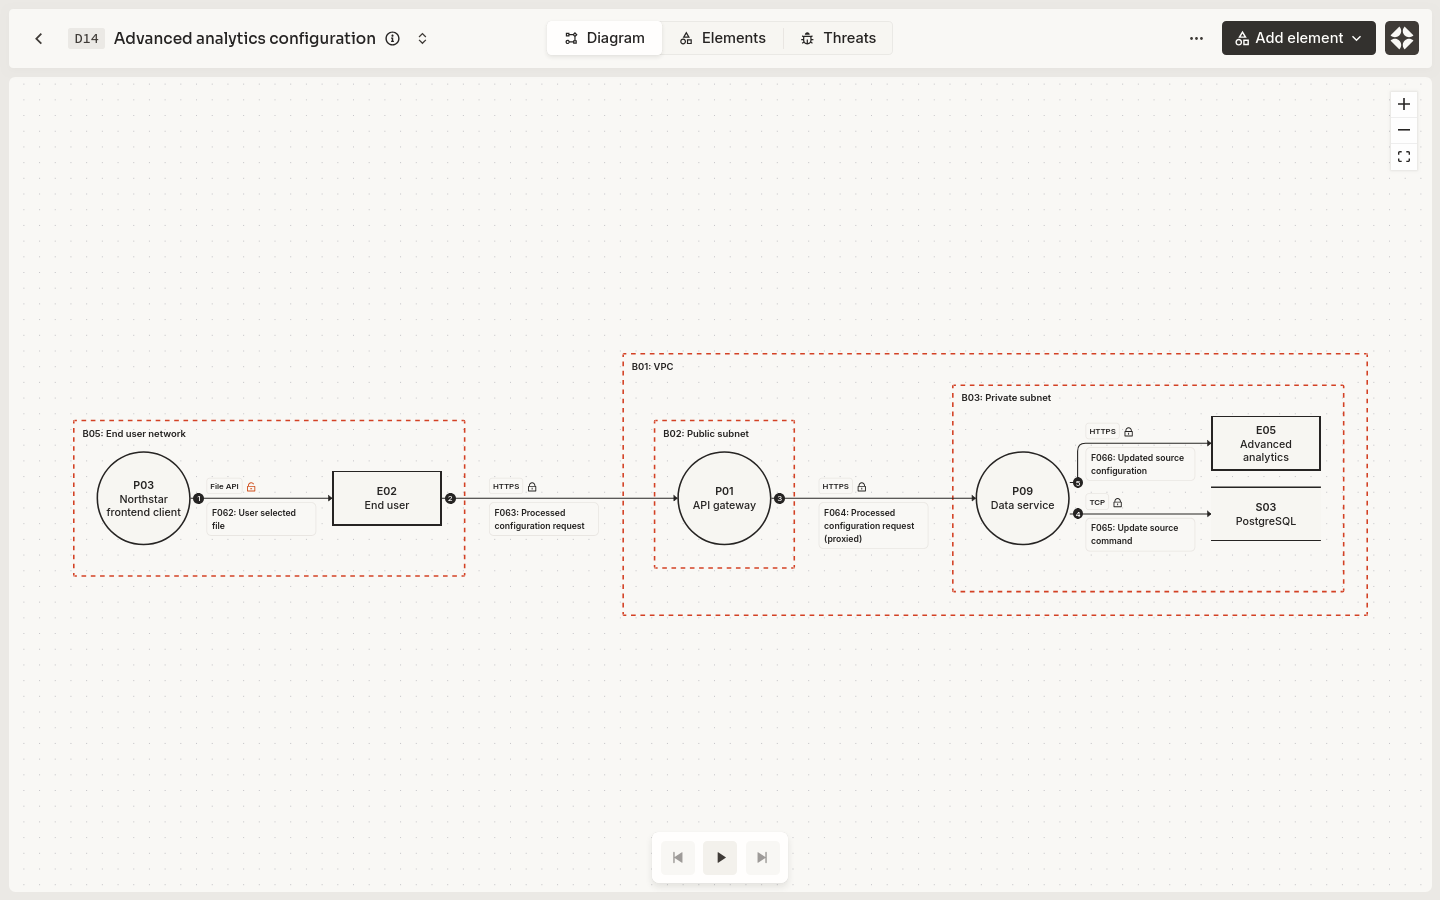 An example data flow diagram
Modeling with diagrams
There are no rules, but it is often a good idea to start with a high-level overview diagram that shows the main parts of the system and how they interact. Then create additional diagrams to model individual features, workflows, or components in more detail.
A common approach is:
- Create an overview diagram of the complete product (contextual flows are very useful here).
- Identify important features or security-sensitive workflows.
- Create a detailed diagram for each feature.
- Reuse existing project elements wherever they represent the same component.
- Add new elements only when they represent something not already modeled.
This allows the project to contain both a readable overview and detailed views without creating separate or disconnected models.
Diagram contents
A diagram can contain all of the available element types:
- Processes
- Entities
- Stores
- Boundaries
- Flows
A diagram does not need to show every element in the project. It should include only the elements and relationships needed to explain the system or feature being modeled.
Reusing elements
Diagrams reference elements from the project. The same process, entity, store, boundary, or flow can appear in multiple diagrams. Reusing an element ensures that its metadata, assets, assessment state, and threats remain connected across the entire project.
An element should not be duplicated solely because it appears in a different diagram.
Automatic layout
Lantern diagrams do not store coordinates, element positions, element sizes, or manually routed flow paths in the project graph. Instead, Lantern automatically lays out each data flow diagram from its elements and relationships.
The stored model describes:
- Which project elements appear in the diagram
- Which flows connect them
- Which boundaries contain them
- The ordering of flows
Lantern uses this structural information to generate each diagram's visual layout automatically. This keeps presentation details out of the security model and the diagram layouts can be regenerated automatically from the current graph whenever something changes.
Ordered flows
A common limitation of data flow diagrams is that the sequence of interactions can be difficult to follow, often requiring a separate sequence diagram for clarification. Lantern addresses this with ordered flows.
Flows can be assigned an order within a diagram to communicate the sequence of interactions in a workflow and make complex diagrams easier to read.
In diagrams with ordered flows, users can click the play button to step through the flows and highlight each interaction in sequence.
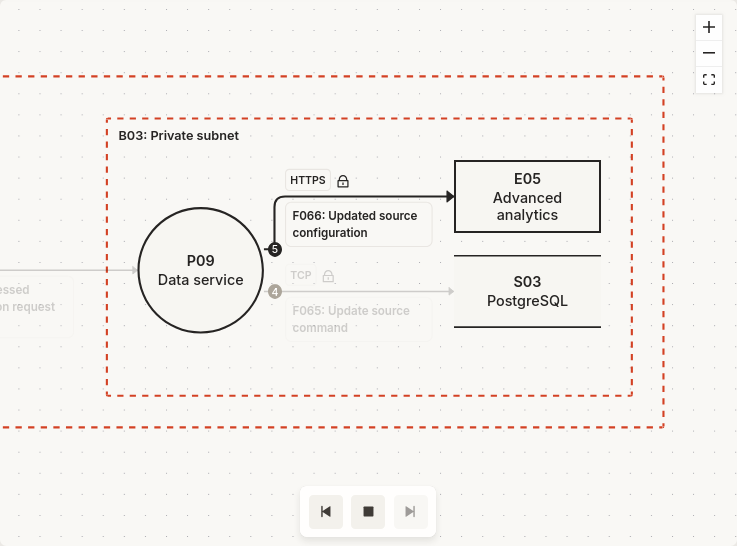 Stepping through ordered flows in a DFD
The order belongs to the diagram and is intended to improve readability. It does not change the underlying relationships between the elements.
Diagrams and threat assessment
Diagrams support assessment by focusing attention on relevant parts of the project and presenting them in a way that makes the system easier to understand.
When a threat is identified in a diagram, it is also linked to that diagram. This makes it possible to view only the threats that are relevant to the elements and interactions shown in a particular diagram.